概要
Vue と D3.js を使って簡単なチャートを作ってみます。
セットアップ
必要なライブラリをインストールします。
npm install d3-array d3-scale d3-shape
チャートの描写
チャート本体のコンポーネントを作っていきます。
<script setup>
import { scaleLinear } from 'd3-scale'
import { extent } from 'd3-array'
import { line } from 'd3-shape'
const data = [
{ x: 1, y: 2 },
{ x: 2, y: 3 },
{ x: 3, y: 5 },
{ x: 4, y: 4 },
{ x: 5, y: 7 }
]
const w = 600
const h = 600
const margin = {
top: 40,
bottom: 40,
left: 40,
right: 40
}
const width = w - margin.right - margin.left
const height = h - margin.top - margin.bottom
const xScale = scaleLinear()
.domain(extent(data, d => d.x))
.range([0, width])
const yScale = scaleLinear()
.domain(extent(data, d => d.y))
.range([height, 0])
const lineFunction = line()
.x(d => xScale(d.x))
.y(d => yScale(d.y))
</script>
<template>
<div>
<svg :width="w" :height="h">
<g :transform="`translate(${margin.left},${margin.top})`">
<path :d="lineFunction(data)" stroke="black" fill="none"></path>
</g>
</svg>
</div>
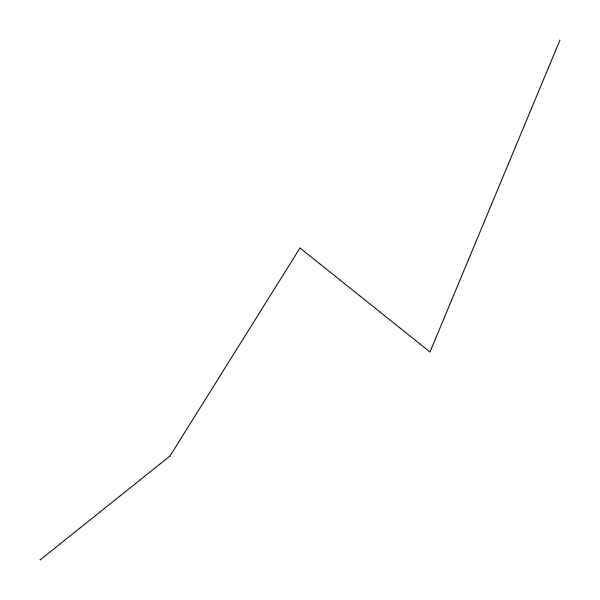
</template>
画面ではこのように描写されます。
XY軸の追加
これだけだとさびしいので次にX軸とY軸の線を追加していきます。 まずはX軸から。
<script setup>
defineProps({
  xScale: Object,
  height: Number
})

const textPadding = 10
</script>

<template>
  <g v-for="(d,i) in xScale.ticks(5)" :key="i">
    <line
      :y1="0"
      :y2="height"
      :x1="xScale(d)"
      :x2="xScale(d)"
      :style='{ stroke: "#e4e5eb" }'
    />
    <text
      dy=".71em"
      :x="xScale(d)"
      :y="height + textPadding"
      :style='{ textAnchor: "middle", fontSize: 12 }'
    >{{ d }}</text>
  </g>
</template>
xScale.ticks(5)でスケールの刻み幅を指定しています。
次にY軸です。
<script setup>
defineProps({
  yScale: Object,
  width: Number
})

const textPadding = -20
</script>

<template>
  <g v-for="(d,i) in yScale.ticks(5)" :key="i">
    <line
      :y1="yScale(d)"
      :y2="yScale(d)"
      :x1="0"
      :x2="width"
      :style='{ stroke: "#e4e5eb" }'
    />
    <text
      :x="textPadding"
      dy=".32em"
      :y="yScale(d)"
      :style='{ fontSize: 12 }'
    >{{ d }}</text>
  </g>
</template>
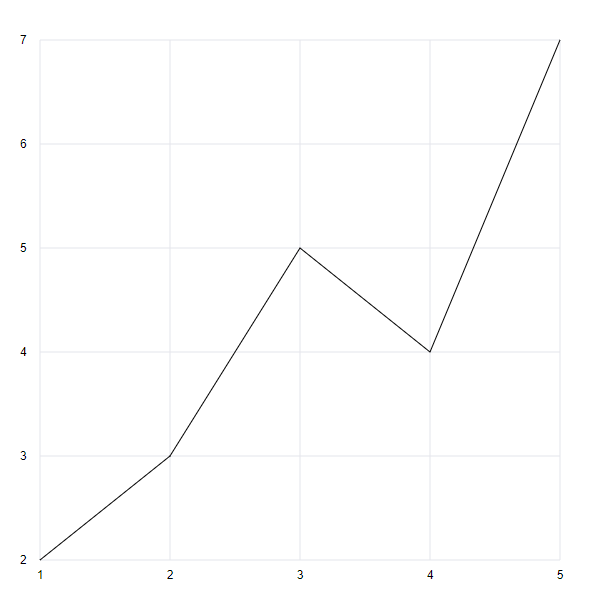
XY軸コンポーネントが完成したので先ほどのチャートと組み合わせます。
<template>
  <div>
    <svg :width="w" :height="h">
      <g :transform="`translate(${margin.left},${margin.top})`">
        <XAxis :x-scale="xScale" :height="height" />
        <YAxis :y-scale="yScale" :width="width" />
        <path :d="lineFunction(data)" stroke="black" fill="none"></path>
      </g>
    </svg>
  </div>
</template>
画面を確認すると軸が表示されるようになりました。